I saw this tweet by Glenn Sarti where he was building a graph database of the PowerShell help system as a way to demonstrate Neo4j.
@MSFTzachal As promised I wrote my PowerShell Help graph presentation (PS Summit) as a blog post instead https://t.co/zuQzXf7ysy
— Glenn Sarti (@GlennSarti) May 7, 2017
I thought it was a cool idea and I was curious what I could do with my PSGraph module on that same dataset. I am pulling examples right from Glenn Sarti’s article because he did a great job explaining it.
PowerShell help example
His first example shows the data we are working with.
C:\> get-help get-item

NAME
    Get-Item
...
RELATED LINKS
    Online Version: http://go.microsof ...
    Clear-Item
    Copy-Item
    Invoke-Item
    Move-Item
...
Most help items have these related links. This will let us map the relationship of commands to each other.
Parsing the help
Glenn has a script on his post that walks the help for every module and cmdlet. He then imports it into a graph database. This is where I am going to take it a different direction. I have a simplified version of his script here that uses PSGraph instead.
$ModuleName = 'Microsoft.PowerShell.Utility'

$graph = graph help {
    $commandList = Get-Command -Module $ModuleName
    foreach($command in $commandList)
    {
        $help = Get-Help -Name $command.name
        $links = $help.relatedLinks.navigationLink.linktext | where {$_ -notmatch 'online version|http:'}
        edge -From $command.name -To $links
    }
}

$graph | Export-PSGraph -ShowGraph
I define a graph and walk each command. Once I pull out the related links, I call the edge command to build an edge from the name node to the $links node. It is ok if $links is an array. The edge command handles multiple items correctly. By defining an edge between two items, the nodes get created automatically.
I am only graphing one module at a time because too many nodes on a single graph is hard to read. There is also not a lot of overlap between modules so I don’t feel like I am missing anything.
Resulting graph
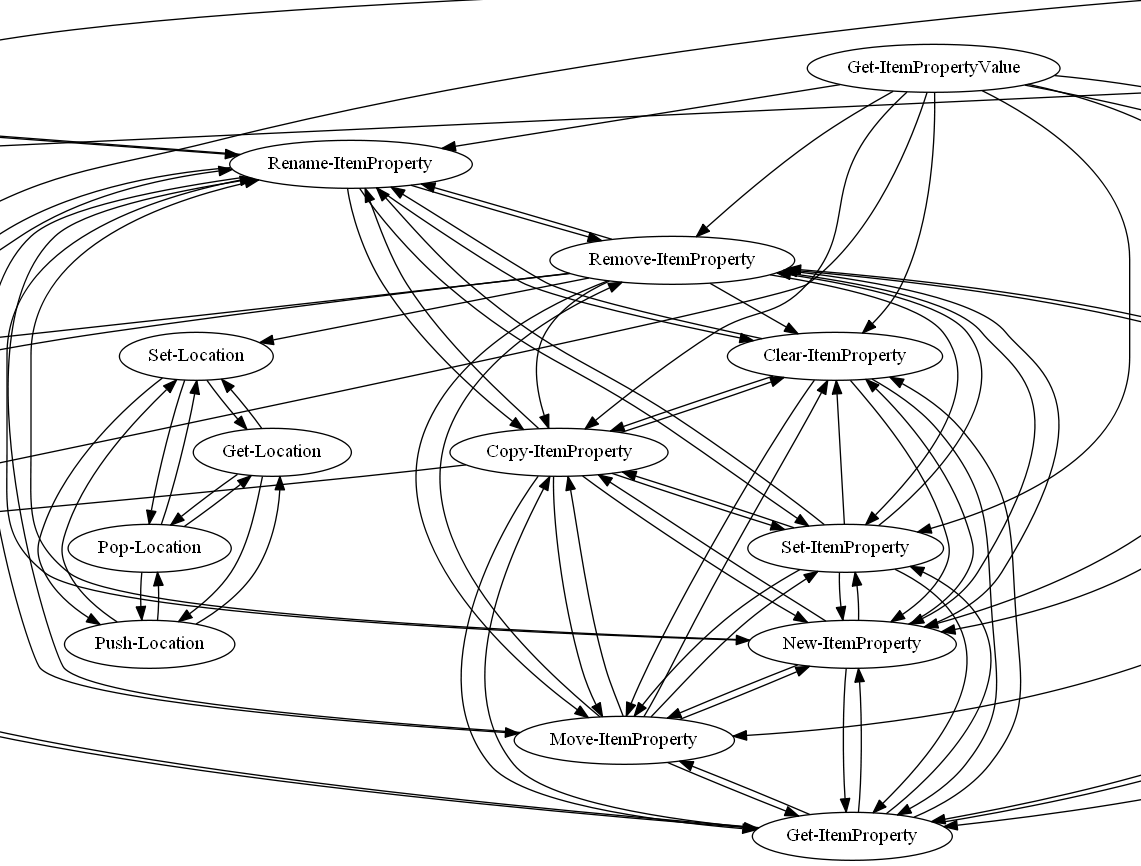
The resulting graphs can get rather large but here is a cropped sample from the Microsoft.PowerShell.Utility module.

The whole reason I wrote PSGraph was to be able to visualize data like this very easily.
Closing remarks
I want to say thank you to Glenn for the idea. I hope he does not mind me building off his article like this. If you would like more information on how to install or use PSGraph, please check this post where I cover it in more detail.