I was just at the PowerShell and DevOps Summit last week. It was great to meet so many of the people that I have worked with online. I also walked way with several ideas that I wanted to work on.
One idea came to me while sitting in Kirk Munro’s session on debugging. I was writing a lot of notes and reflecting on how I was debugging my scripts. Then I realized I could make a simple function to make it easier.
Index
The Idea
I often check the $error[0].ScriptStackTrace for the source of an error and then go place a breakpoint where the error was raised. I realized that I could parse the ScriptStackTrace and call Set-PSBreakPoint directly. It is a fairly simple idea and it turned out to be just as easy to write.
Putting it all together
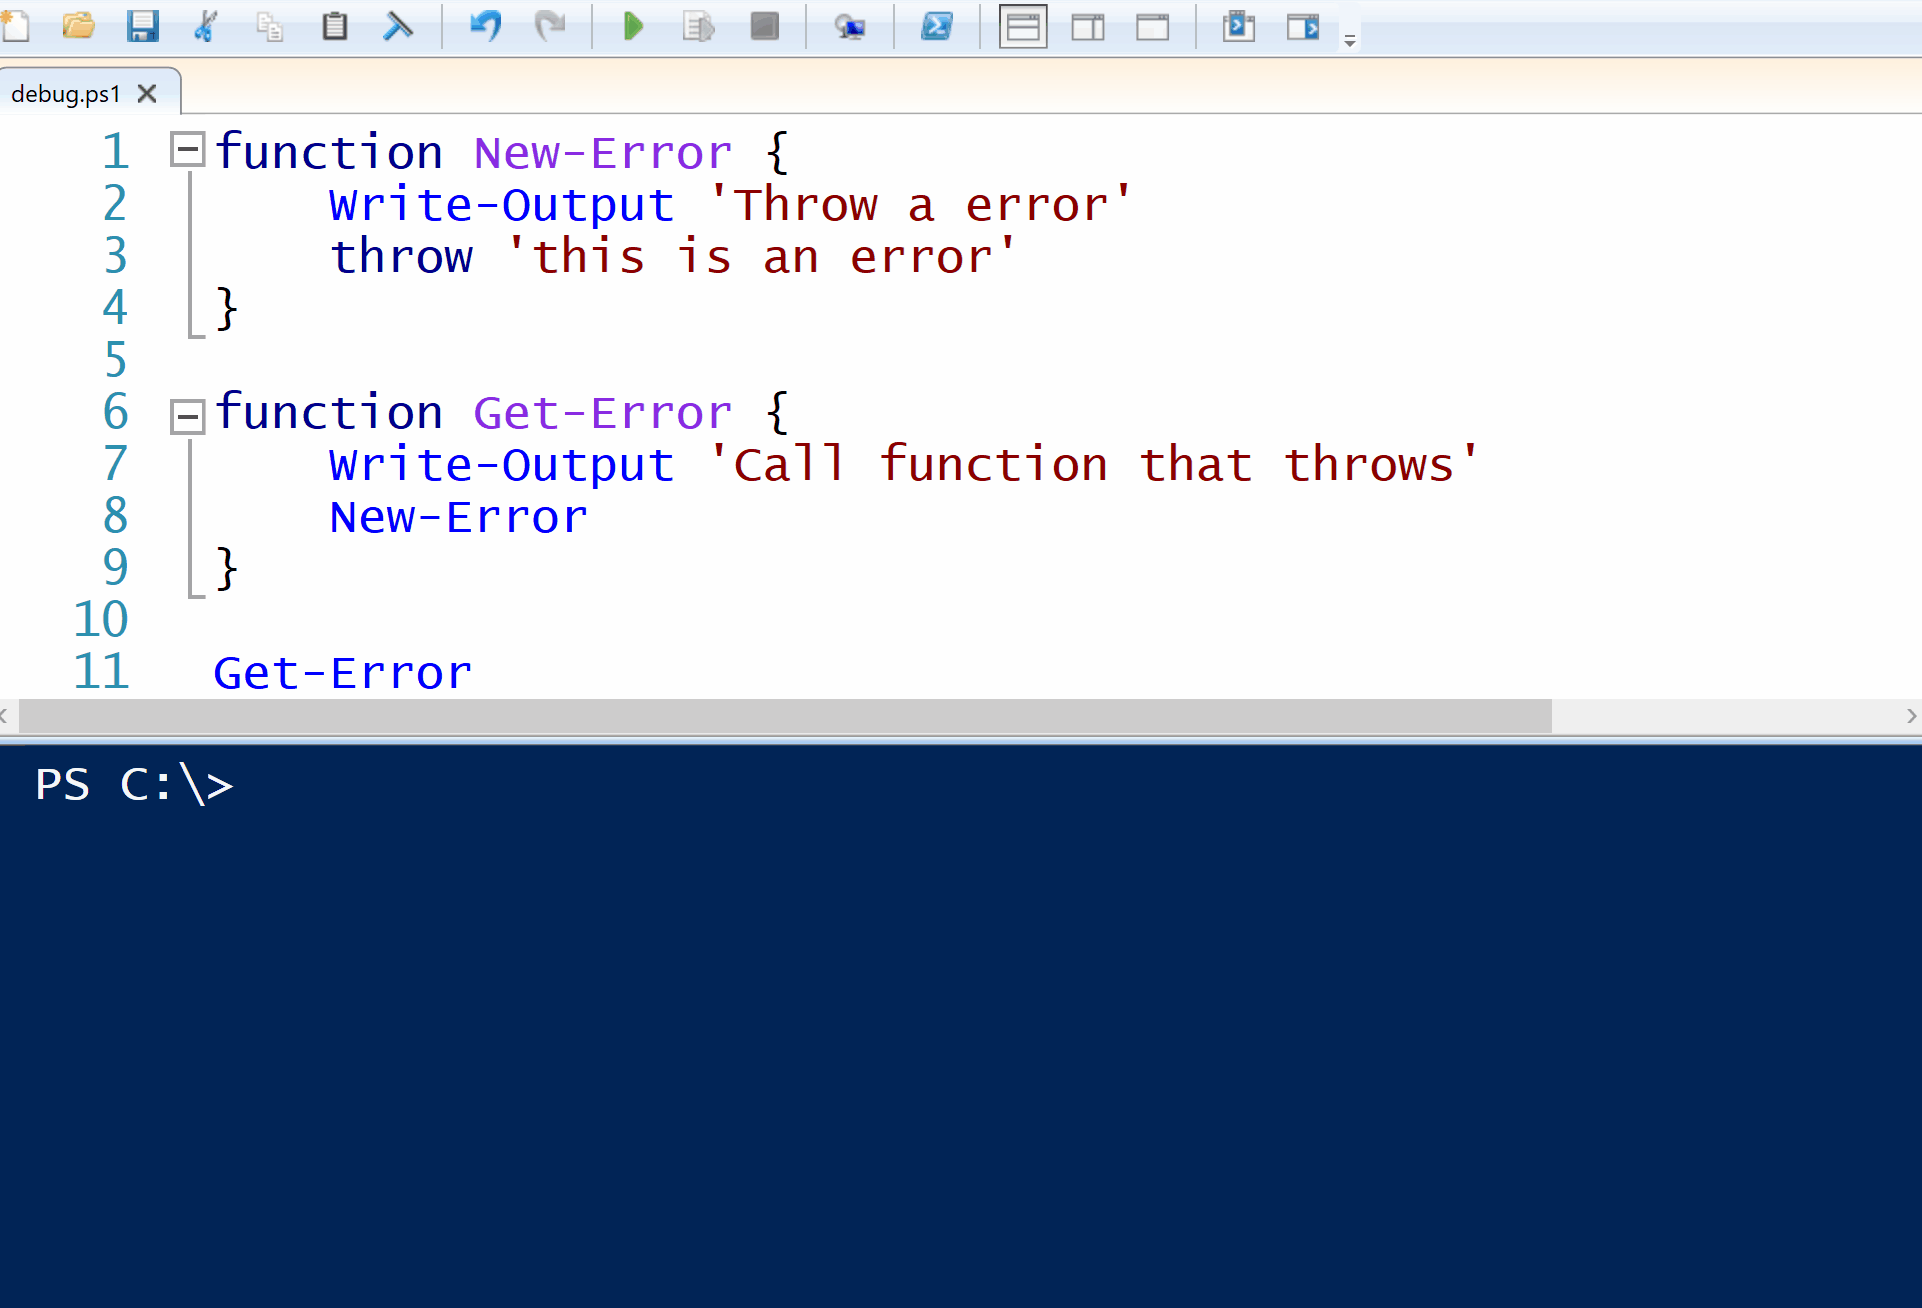
If you ever looked at a ScriptStackTrace on an error, you would see something like this:
PS> $error[0].ScriptStackTrace
at New-Error, C:\workspace\ConvertTo-Breakpoint\testing.ps1: line 2
at Get-Error, C:\workspace\ConvertTo-Breakpoint\testing.ps1: line 6
at <ScriptBlock>, C:\workspace\ConvertTo-Breakpoint\testing.ps1: line 9
While the data is just a string, it is very consistent and easy to parse with regex. Here is the regex pattern that I used to match each line: at .+, (?<Script>.+): line (?<Line>\d+)
I was a little fancy and used named sub-expression matches. I do this so I can access them by name with $matches.Script and $matches.Line.
Once I had the data that I needed, it was a quick call to Set-PSBreakPoint to set the breakpoint.
Set-PSBreakPoint -Script $matches.Script -Line $matches.Line
I put a bit more polish on it and called it ConvertTo-Breakpoint.
I do a full step by step walk of the entire function in this video: ConvertTo-Breakpoint: Writing the cmdlet.
How to use
This is the cool part. I can now take any $error and pipe it to ConvertTo-Breakpoint. Then a breakpoint will be created where the error was thrown.
$error[0] | ConvertTo-BreakPoint
I added proper pipeline support so you can give it all your errors.
$error | ConvertTo-BreakPoint
I even added -All as a switch to create a breakpoint at each point in the callstack instead of just the source of the error.
$error[0] | ConvertTo-BreakPoint -All
VSCode debugger
In my experimentation with VSCode and Set-PSBreakpoint; I discovered that you have to have the debugger running for Set-PSBreakpoint to set breakpoints. There is an issue on github about this already. This is why I did the demo video in the ISE.
Where do I find it?
This is already published in the PSGallery. You can install it and start experimenting with it right away.
Install-Module -Name ConvertTo-Breakpoint -Scope CurrentUser
If you would like to checkout the source, I published it on github with all my other tools:
More videos
I tried something new and recored the creation of this module from the start. I walk through the idea, prototype it, create tests, create the function, build the module, add build scripts, and publish it. The entire process was captured.
- Git setup & proof of concept
- Proof of concept part 2
- Writting the function
- Create the module
- Add build scripts
- Add build scripts part 2
- Refactor
- Bug hunt
Let me know on Twitter if this is something you would like to see me do more of. I would love to hear your feedback.