I just published a new module to the Powershell Gallery. Calling this one Chronometer because it has the ability to track line by line script execution times. It also has the fun side effect of showing your code coverage visually if you run it with pester.

- How does that work?
- Requirements and how to install
- Format-Chronometer
- Rich objects
- Get-Chronometer
- Limitations and other details
- What’s next?
How does that work?
This idea was inspired by Pester’s ability to give you the code coverage of your tests. I took a close look at it and they did something clever. They set a breakpoint for every line in the specified script. Then after they run all the tests, they walk the breakpoints to see how many were hit.
I decided to do the same thing and measure the time deltas between executions. I was able to flesh out a working prototype fairly quickly and then spent the next several days polishing it into something usable.
Because I have the line by line execution times, I also tracked how many times each line was ran. There are also other stats that I collect like average, min and max times.
Requirements and how to install
Powershell 5.0
This module does require Powershell 5.0. I make use of classes in this module so that is why 5.0 is required.
Install-Module Chronometer
I am publishing this to the Powershell Gallery so you can quickly install it from there.
Install-Module Chronometer
The source is also published to https://github.com/KevinMarquette/Chronometer.
Format-Chronometer
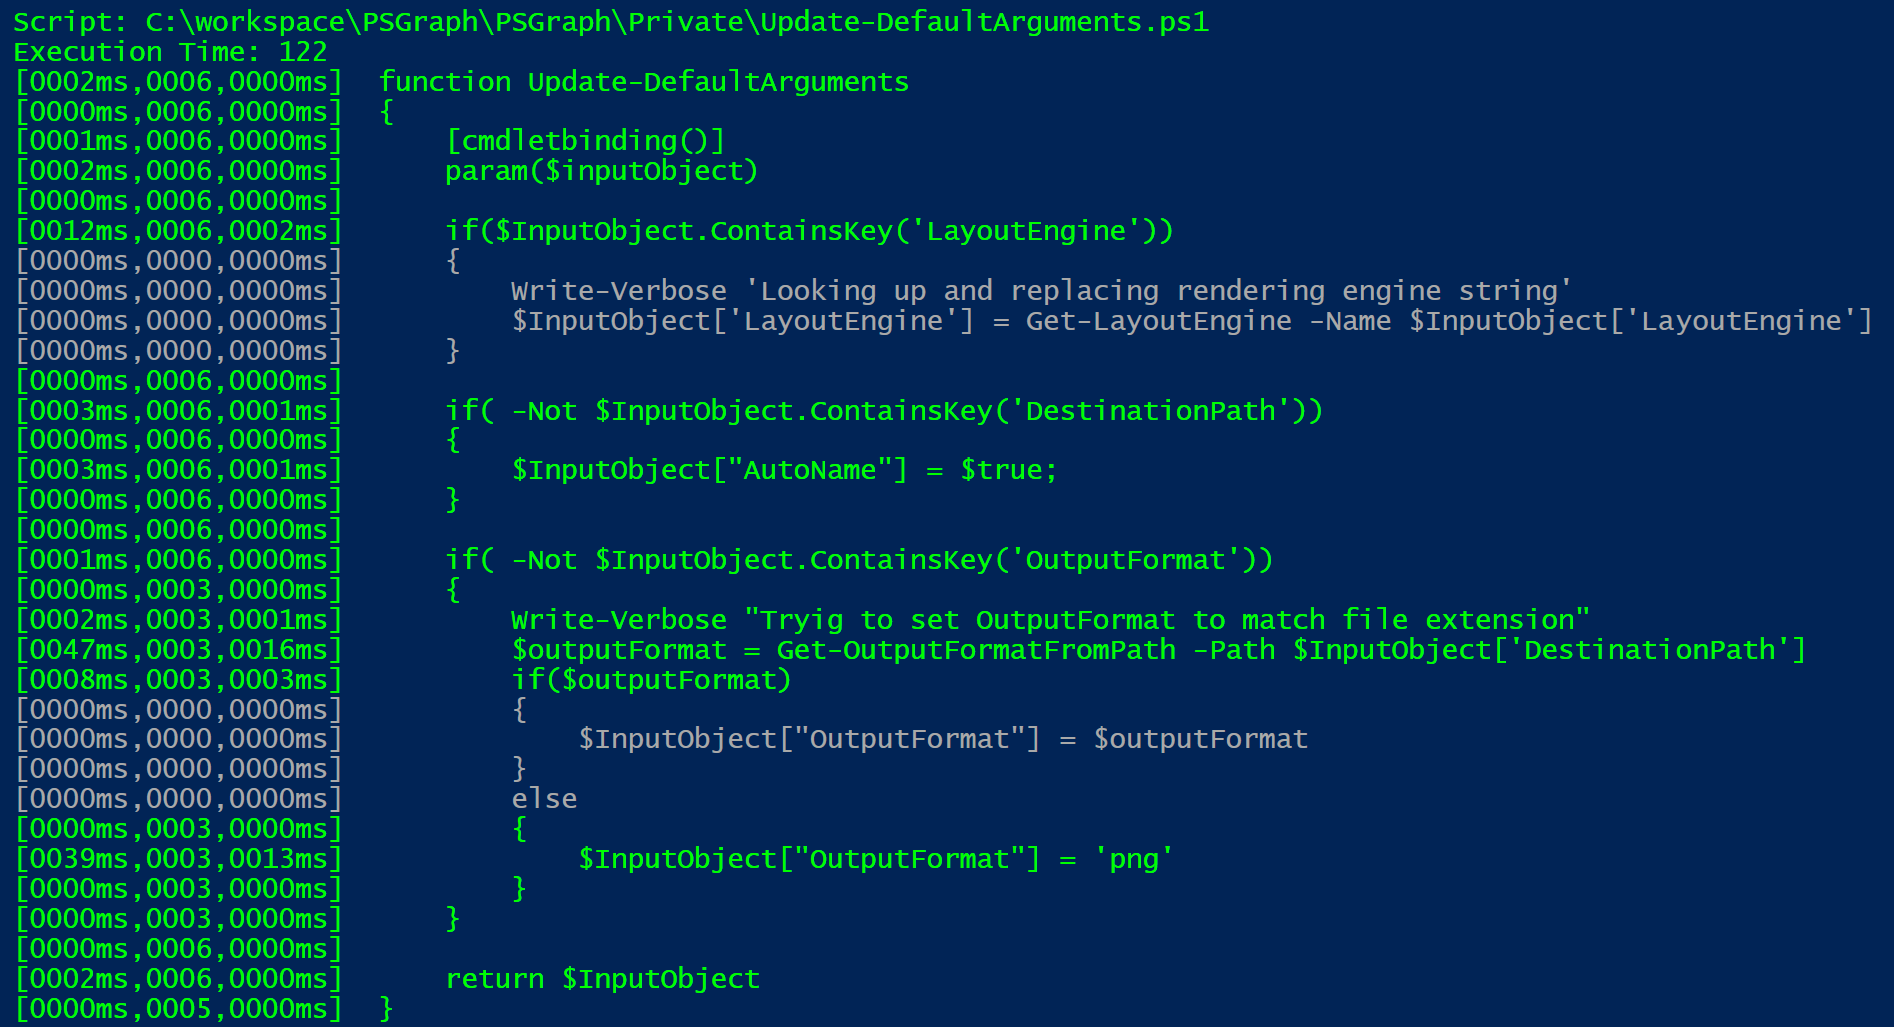
The easiest way to understand it is to look at the resulting report. Then I will loop back to show you how to run it.

We can see a few things from this report. Each line of the source file is represented. The numbers on the left side show the total execution, number of executions and then the average execution time. The colors show gray for the lines that were not executed.
If you specify multiple files, then it will generate a report for each one.
Rich objects
MonitoredScript
While that report is fun to look at, we do have objects to work with. The Get-Chronometer command gives us a list of [MonitoredScript] objects. For each file specified, we get the execution time.
Path          : C:\workspace\PSGraph\PSGraph\Public\Set-NodeFormatScript.ps1
Line          : {[0003ms,0008,0000ms]  function Set-NodeFormatScript, [0000ms,...}
ExecutionTime : 30
LinesOfCode   : 21
This execution time includes the time it spent waiting on other calls to come back. I point this out because if you have one slow function that everything calls, then that slowness will be reflected in all calling scripts.
ScriptLine
The [MonitoredScript] object has a Line property that contains all the [ScriptLine] objects. Here is a sample from one of those objects.
Milliseconds : 1
HitCount     : 8
Min          : 0
Max          : 1
Average      : 0.125
LineNumber   : 19
Path         : C:\workspace\PSGraph\PSGraph\Public\Set-NodeFormatScript.ps1
Text         :     $Script:CustomFormat = $ScriptBlock
I only show a subset of this in the report, but you have access to it all. It is actually the ToString() function on this line that produces the report text.
[0001ms,0008,0000ms] $Script:CustomFormat = $ScriptBlock
Get-Chronometer
So now that we know what we can do, here is how you chronometer a script.
$Chronometer = @{
    Path = '.\myscript.ps1'
    Script = {. .\myscript.ps1}
}
Get-Chronometer @Chronometer | Format-Chronometer
This will monitor the file in the specified path and then execute the command in the script. In this example I am just running that same script.
With pester
I like to combine this with Pester to see code coverage.
$script = Get-ChildItem C:\workspace\PSGraph\PSGraph -Recurse -Filter *.ps1
$Chronometer = @{
    Path = $script.fullname
    Script = {Invoke-Pester C:\workspace\PSGraph}
}
$results = Get-Chronometer @Chronometer
$results | Format-Chronometer
This will load every script in my project and then run all my tests. When it is done, I get to see my code coverage.
With that said, the Pester code coverage feature does a better job. I am taking a lot of shortcuts that Pester is not taking. They even track the sub line expressions.
Limitations and other details
The engine doing the work is fairly simple and limited by what the debugger is tracking. You will see it skip some things that mentally you expect it to hit. My best example is is the if(...){...}else{...} command. It will jump into the else block without counting the else block as a command. That is accurate, but just not how we think about it. Same goes for some open and close braces.
Monitoring and tracking each line of execution does have some overhead. I tried to minimize that overhead by gathering the data quickly and then post processing it for the deltas later.
What’s next?
This is still a work in progress. I am mostly trying to polish the user experience at the moment. I want to make this as easy to work with as possible. Feel free to try it out.